How do dioxins get into the Baltic Sea
- Atmosphere
- Sewage
- Rivers
- the North Sea
How do dioxins get into fish
- food
- water
- deposits
Dioxins are industrial by-products which, among others, appear during the burning of municipal and industrial waste which contain chlorine with an insufficient oxygen supply, during forest fires, when burning diesel oils which contain chlorine and in the regular home furnaces. Their presence in the environment is largely connected with human activity.
These substances are toxic. They accumulate in fat and occur in Baltic fish in larger concentrations than in other food products.
Risks to human health connected with dioxins:
- Toxic impact on the skin – chloracne – irregular eruptions on the skin surface with thickenings and lumps
- Changes in the thyroid hormone levels which result in a impairment of psychomotor capability
- Cancerogenicity (lung cancer, gastrointestinal cancer)
- Danger to women in the first trimester of pregnancy – death of the embryo or development of malformations.
| POLLUTANT | MAXIMUM LEVEL APPLICABLE UNTIL 2012 AT TEF1998 | MAXIMUM LEVEL APPLICABLE UNTIL 1ST JANUARY 2012 AT TEF2005 |
|---|---|---|
| Fish meat and the products derived from it | ||
| Total of (WHO-PCDD/F-TEQ) dioxins | 4 ng/kg fresh mass | 3.5 ng/kg fresh mass |
| Total of dioxins and polychlorinated biphenyls with properties similar to (WHO-PCDD/F + dl-PCB-TEQ) dioxins | 8 ng/kg fresh mass | 6.5 ng/kg fresh mass |
| Total of indicator polychlorinated biphenyls (ndl-PCB) | - | 75 µg/kg fresh mass |
| Eel's muscle tissue | ||
| Total of (WHO-PCDD/F-TEQ) dioxins | 4 ng/kg fresh mass | 3.5 ng/kg fresh mass |
| Total of dioxins and polychlorinated biphenyls with properties similar to (WHO-PCDD/F + dl-PCB-TEQ) dioxins | 12 ng/kg fresh mass | 10 ng/kg fresh mass |
| Total of indicator polychlorinated biphenyls (ndl-PCB) | - | 300 µg/kg fresh mass |
| Fish liver and products derived from it | ||
| Total of dioxins + dl-PCB | - | 20 ng/kg fresh mass |
| Total of indicator PCB (ndl-PCB) | - | 200 µg/kg fresh mass |
| TESTED MATERIAL | WHO-PCDD/F-TEQ [ng/kg] | WHO-PCDD/F + dl-PCB-TEQ [ng/kg] | ndl-PCB [µg/kg] |
|---|---|---|---|
| Fish muscle tissue | |||
| Cod | 0.08 | 1.05 | 0.4 |
| Herring | 1.2 | 2.5 | 17.7 |
| Sprat | 2.2 | 4.68 | 35 |
| Baltic salmon | 3.5 | 9.5 | 44.7 |
| Carp | 0.08 | 0.14 | 1.4 |
| Trout | 0.07 | 0.39 | 5.3 |
| Pollock | 0.007 | 0.015 | 0.023 |
| Sole | 0.009 | 0.03 | 0.15 |
| Pangasius | 0.011 | 0.016 | 0.03 |
| Tilapia | 0.019 | 0.03 | 0.12 |
| Fish products | |||
| Smoked mackerel | 0.24 | 0.84 | 12.1 |
| Smoked sprat | 3.6 | 8.3 | 30.9 |
| Smoked herring | 0.66 | 1.44 | 9.5 |
| Smoked Baltic salmon | 4.53 | 13.12 | 42.7 |
| Smoked Norwegian salmon | 0.34 | 1.71 | 12.6 |
| Smoked trout | 0.12 | 0.58 | 4.9 |
| Salted herring fillets | 0.58 | 1.22 | 7.8 |
| Marinated herring flaps | 1 | 2.07 | 19.2 |
| Baked mackerel in vinegar | 0.41 | 1.37 | 10.1 |
| Canned fish | |||
| Sprat in tomato sauce | 1.8 | 4.1 | 23.5 |
| Sprat in oil | 2.6 | 5.6 | 35.7 |
| Herring in tomato sauce | 1.9 | 3.6 | 20.8 |
| Gdańsk herring | 1.8 | 3.6 | 24.7 |
| Tuna in oil | 0.36 | 0.39 | 9.1 |
| Mackerel in tomato sauce | 0.28 | 0.9 | 6.7 |
| Mackerel in oil | 0.33 | 1.09 | 9.7 |
| Sardine in oil | 0.68 | 2.96 | 12.8 |
| Paprykarz szczeciński (canned fish spread) | 0.7 | 1.6 | 9.7 |
Changes in the dioxins + dl PCB content in Baltic fish
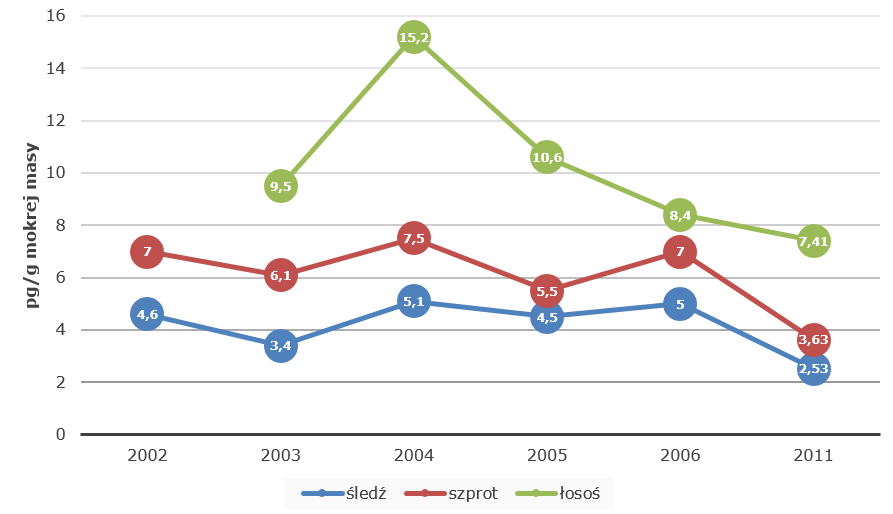
pg/g of wet weight
herring – sprat – salmon