The Department of Fisheries Resources conducts a wide range of research aimed at the rational management of fish resources. The scientific activities of the department focus mainly on studying the dynamics of commercial fish populations, we analyze the effects of environmental factors on fish and monitor their diseases. There is also a genetics laboratory, where research on the genetics of commercial fish populations is conducted. The research supports the stock estimation process by identifying the distribution and range of individual fish populations. Today we want to introduce you to the specifics of the work performed in the laboratory – in room 819. Thus, we will trace the path that genetic material (DNA/RNA) goes through, starting from the cells of a living organism and ending with the raw data – that is, the established genotype or the read DNA/RNA sequence. We will also present the scope of the genetic tests performed, briefly discussing their practical application.
Isolation of Genetic Material
At the outset, it should be emphasized that working in a genetics laboratory requires extreme precision and cleanliness. DNA is invisible to the naked eye, and the amounts of material (solution) we handle are usually thousandths or millionths parts of a liter (video 1).
The process of isolating genetic material is a journey that begins with fish fin fragments, and sometimes with otoliths (hard structures in the inner ear of fish) or scales. Thanks to the possibility of using such material, we can analyze not only fresh samples, but also archival material, going back to resources from the 1960s, for example.
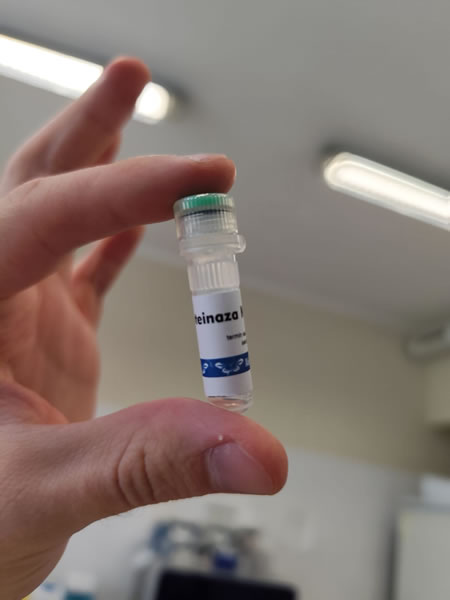
The first step is to homogenize the samples in a special buffer. It involves mechanical or chemical disintegration of the tissue, which effectively releases the DNA from the cells. The enzyme proteinase K, added at this stage, breaks down cell membrane proteins (Photo 1), the thermoblock (Photo 2) provides the optimal temperature for the enzymatic reaction, and the vortex (video 2) vigorously shakes the mixture to mechanically disrupt the cell membranes.
 |
 |
||
| Photo 1. 1 milliliter of Proteinase K is used to homogenize about 50 samples | Photo 2. Thermoblock heating in samples during homogenization |
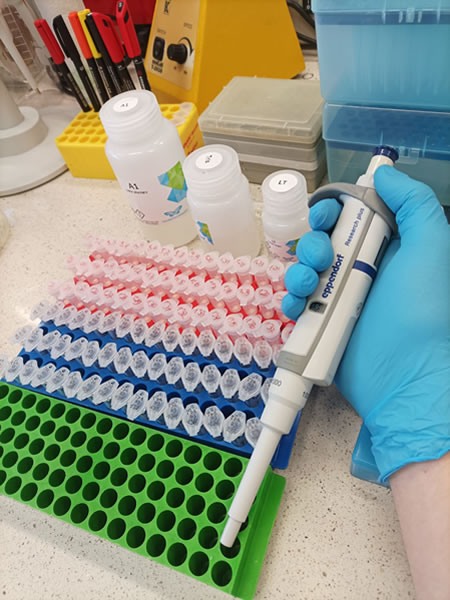
As a result of this process, DNA is released into the buffer, forming a homogeneous mixture with other organic and inorganic compounds, from which DNA can be further separated. For this process we use silica columns (Photos 3,4). They act as precision filters, selectively binding only nucleic acids and separating them from other cellular components. After several steps of washing away other compounds, the DNA elution process follows. Elution involves passing a special buffer through the column to flush out bound DNA. This yields pure genetic material ready for further analysis. Due to the minimal amount of DNA extracted, the NanoDrop spectrophotometer (Photo 5) is an extremely useful instrument.
 |
 |
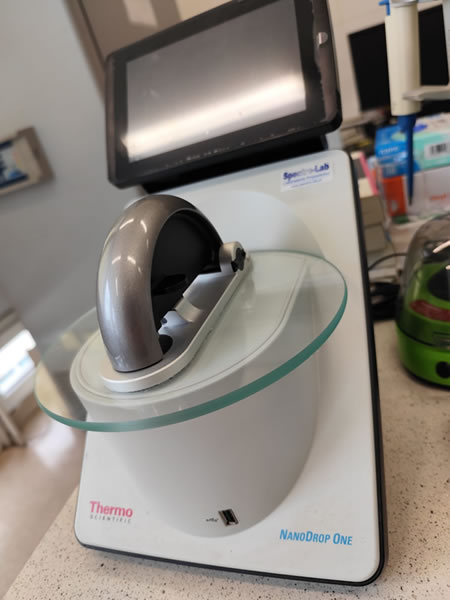 |
| Photo 3. Silica bed microcolumn (white layer in the element on the left) used to isolate genetic material | Photo 4. It is not difficult to guess that one of the most commonly used tools in genetic work is the automatic micropipette | Photo 5. NanoDrop One spectrophotometer – measurement of DNA/RNA concentration and purity |
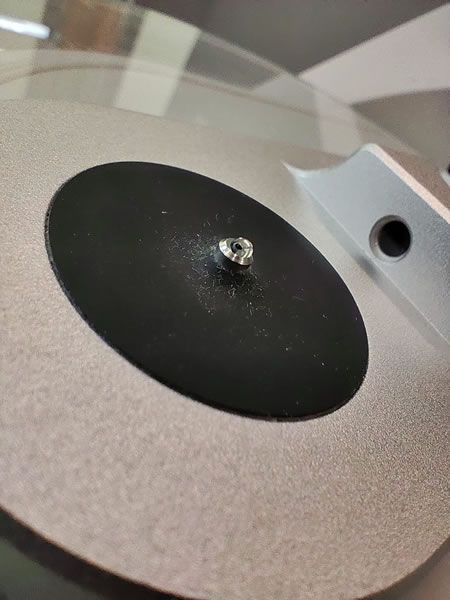
It accurately assesses the concentration and purity of DNA in a 1 ul -drop of solution (Photo 6). The result of this analysis is crucial to the success of subsequent testing steps, as high quality and adequate DNA determine the feasibility and reliability of subsequent procedures.
Polymerase Chain Reaction (PCR)
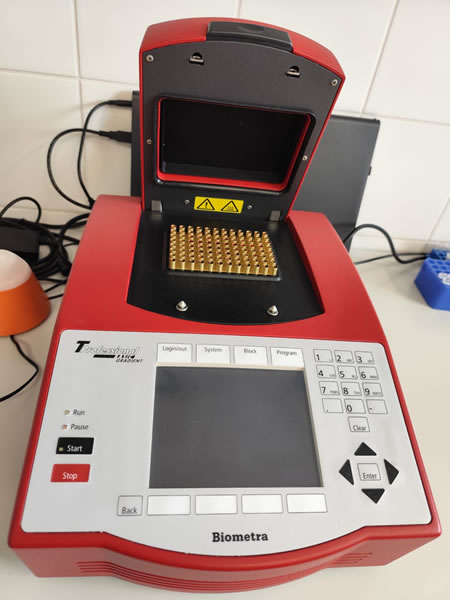
After isolating the genetic material, we have too little DNA to perform detailed analyses. To obtain more DNA, we use a technique called PCR (Polymerase Chain Reaction). It allows us to duplicate the DNA fragments of interest multiple times. This process takes place in a thermocycler (Photo 7), which provides the rapid changes and precise temperature control required for the PCR reaction. It occurs in three steps. First, the high temperature separates the spirally twisted two DNA strands in a process called denaturation. Then, at a lower temperature, specific primers – short DNA sequences of our choice – attach to selected sites on the DNA strand – this stage is called annealing . In the last phase, the temperature is raised so that DNA polymerase (the enzyme that synthesizes new DNA strands) can do its job in a process called elongation. These cycles are repeated many times to make millions of copies of DNA. Amplification can involve genes as well as other non-coding DNA fragments, such as the microsatellite markers (short, repetitive DNA sequences) often used in our analyses. Microsatellites are special markers applicable to the analysis of genetic diversity and population structure, as they are characterized by high variability. This makes it possible to distinguish between individual organisms or populations. Some studies require determining at the outset the amount of DNA being copied – a quantitative PCR or qPCR apparatus purchased last year is used for this purpose (Photo 8).
 |
 |
 |
| Photo 6. 1.5 microliters of liquid (a drop the size of a pin head) is sufficient to determine the amount of DNA | Photo 7. Thermocycler controlling the temperature during the PCR reaction | Photo 8. apparatus for qPCR or quantitative PCR reaction |
Electrophoresis
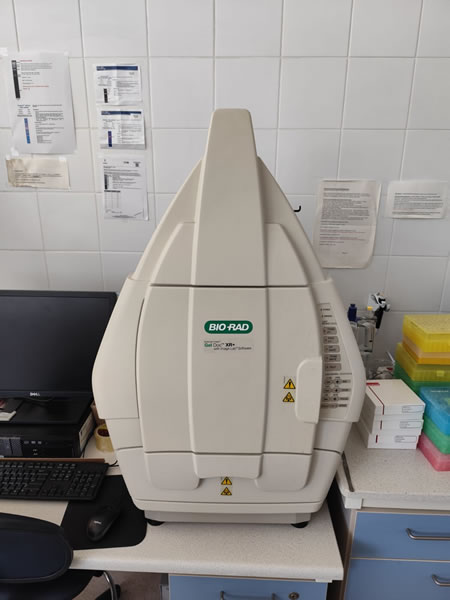
Sometimes the next steps in DNA analysis require visualization of the genetic material. One way to do this is to separate the duplicated DNA on an agarose gel during a process called electrophoresis. The gel acts as a molecular filter that separates DNA fragments according to their size. When exposed to an electric current, smaller DNA fragments move faster than larger ones, migrating in the gel from the negative pole to the positive pole (Photo 9). After electrophoresis, the DNA is visualised under UV light using Bio-Rad’s Gel Imaging System (Photo 10). The fluorescently stained DNA fragments are clearly visible, making it possible to determine their exact position. To determine the size of the DNA fragments under study, a size marker is added to the path in the gel, which resembles a characteristic ladder in electrophoretic separation. This is a set of DNA fragments of known lengths (Photo 11).
 |
 |
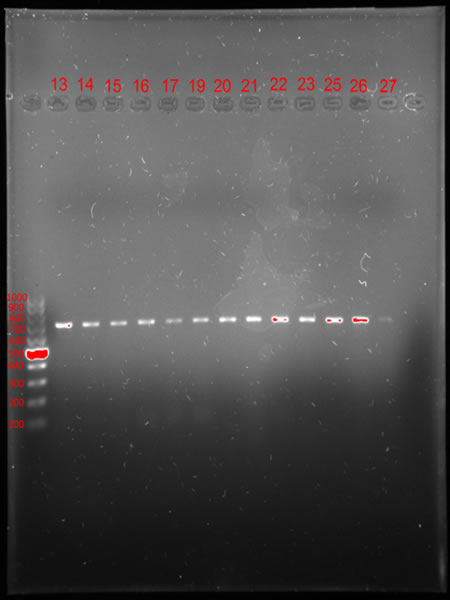 |
| Photo 9: Agarose gel electrophoresis apparatus | Photo 10. Apparatus for imaging the results of electrophoretic separations | Photo.11. DNA separation during agarose electrophoresis – size marker bars (left) allow us to determine the size of the DNA fragment we are studying in base pairs (lanes 13-27) |
Further Analysis
Once the DNA fragments have been duplicated, the next step is to genotype or sequence them. Genotyping a duplicated DNA/RNA fragment, for example, involves determining its precise length (in units called base pairs – Fig. 12).
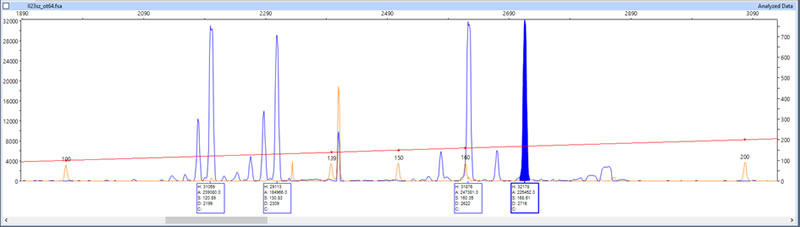 Photo 12. Genotyping result showing the lengths of four pike DNA fragments
Sequencing, on the other hand, allows us to read the exact nucleotide sequence in the duplicated fragments. Often it is only at this stage that we see the result of our work, i.e. whether or not the right genetic data has been obtained. Only now do potential complications, such as sample contamination or inaccurate primer attachment during the PCR reaction, become apparent. It is on the basis of this data that further analyses and interpretations are carried out.
The data we obtain allow us to solve a number of research problems related to fish population management and biodiversity conservation. Our primary activity is to determine the population structure of individual fish species, that is, we provide information on the geographic range and genetic variation between populations of a given species. We also determine the level of genetic variability in the populations under study. High genetic diversity is often an indicator of population health and a measure of a population’s ability to survive in the face of environmental change or fishing pressure. Information relating to the level of genetic variability and the analyses we perform to confirm membership in a population are also essential when conducting stocking or restocking programs – they allow us to select an appropriate gene pool of individuals used for spawning. We verify the effectiveness of conducted stocking (e.g. in the trout stocking of Polish rivers, which has been conducted for years), identifying fish in rivers from artificial spawning and those from natural reproduction. We also carry out species identification of fish and their hybrids, in situations where morphometric methods are unable to give a precise answer or when we are dealing with a food product for which we want to confirm the species composition. Species identification can also apply to parasites found in fish, but can be extended to marine organisms in general. Last year we began to join in environmental analysis, monitoring the presence and quantity of golden algae in the waters of the Szczecin Lagoon. We are growing every year, trying to get involved in new research problems and cooperating with various facilities within the NMFRI.
Remigiusz Szymański
Anna Wąs-Barcz